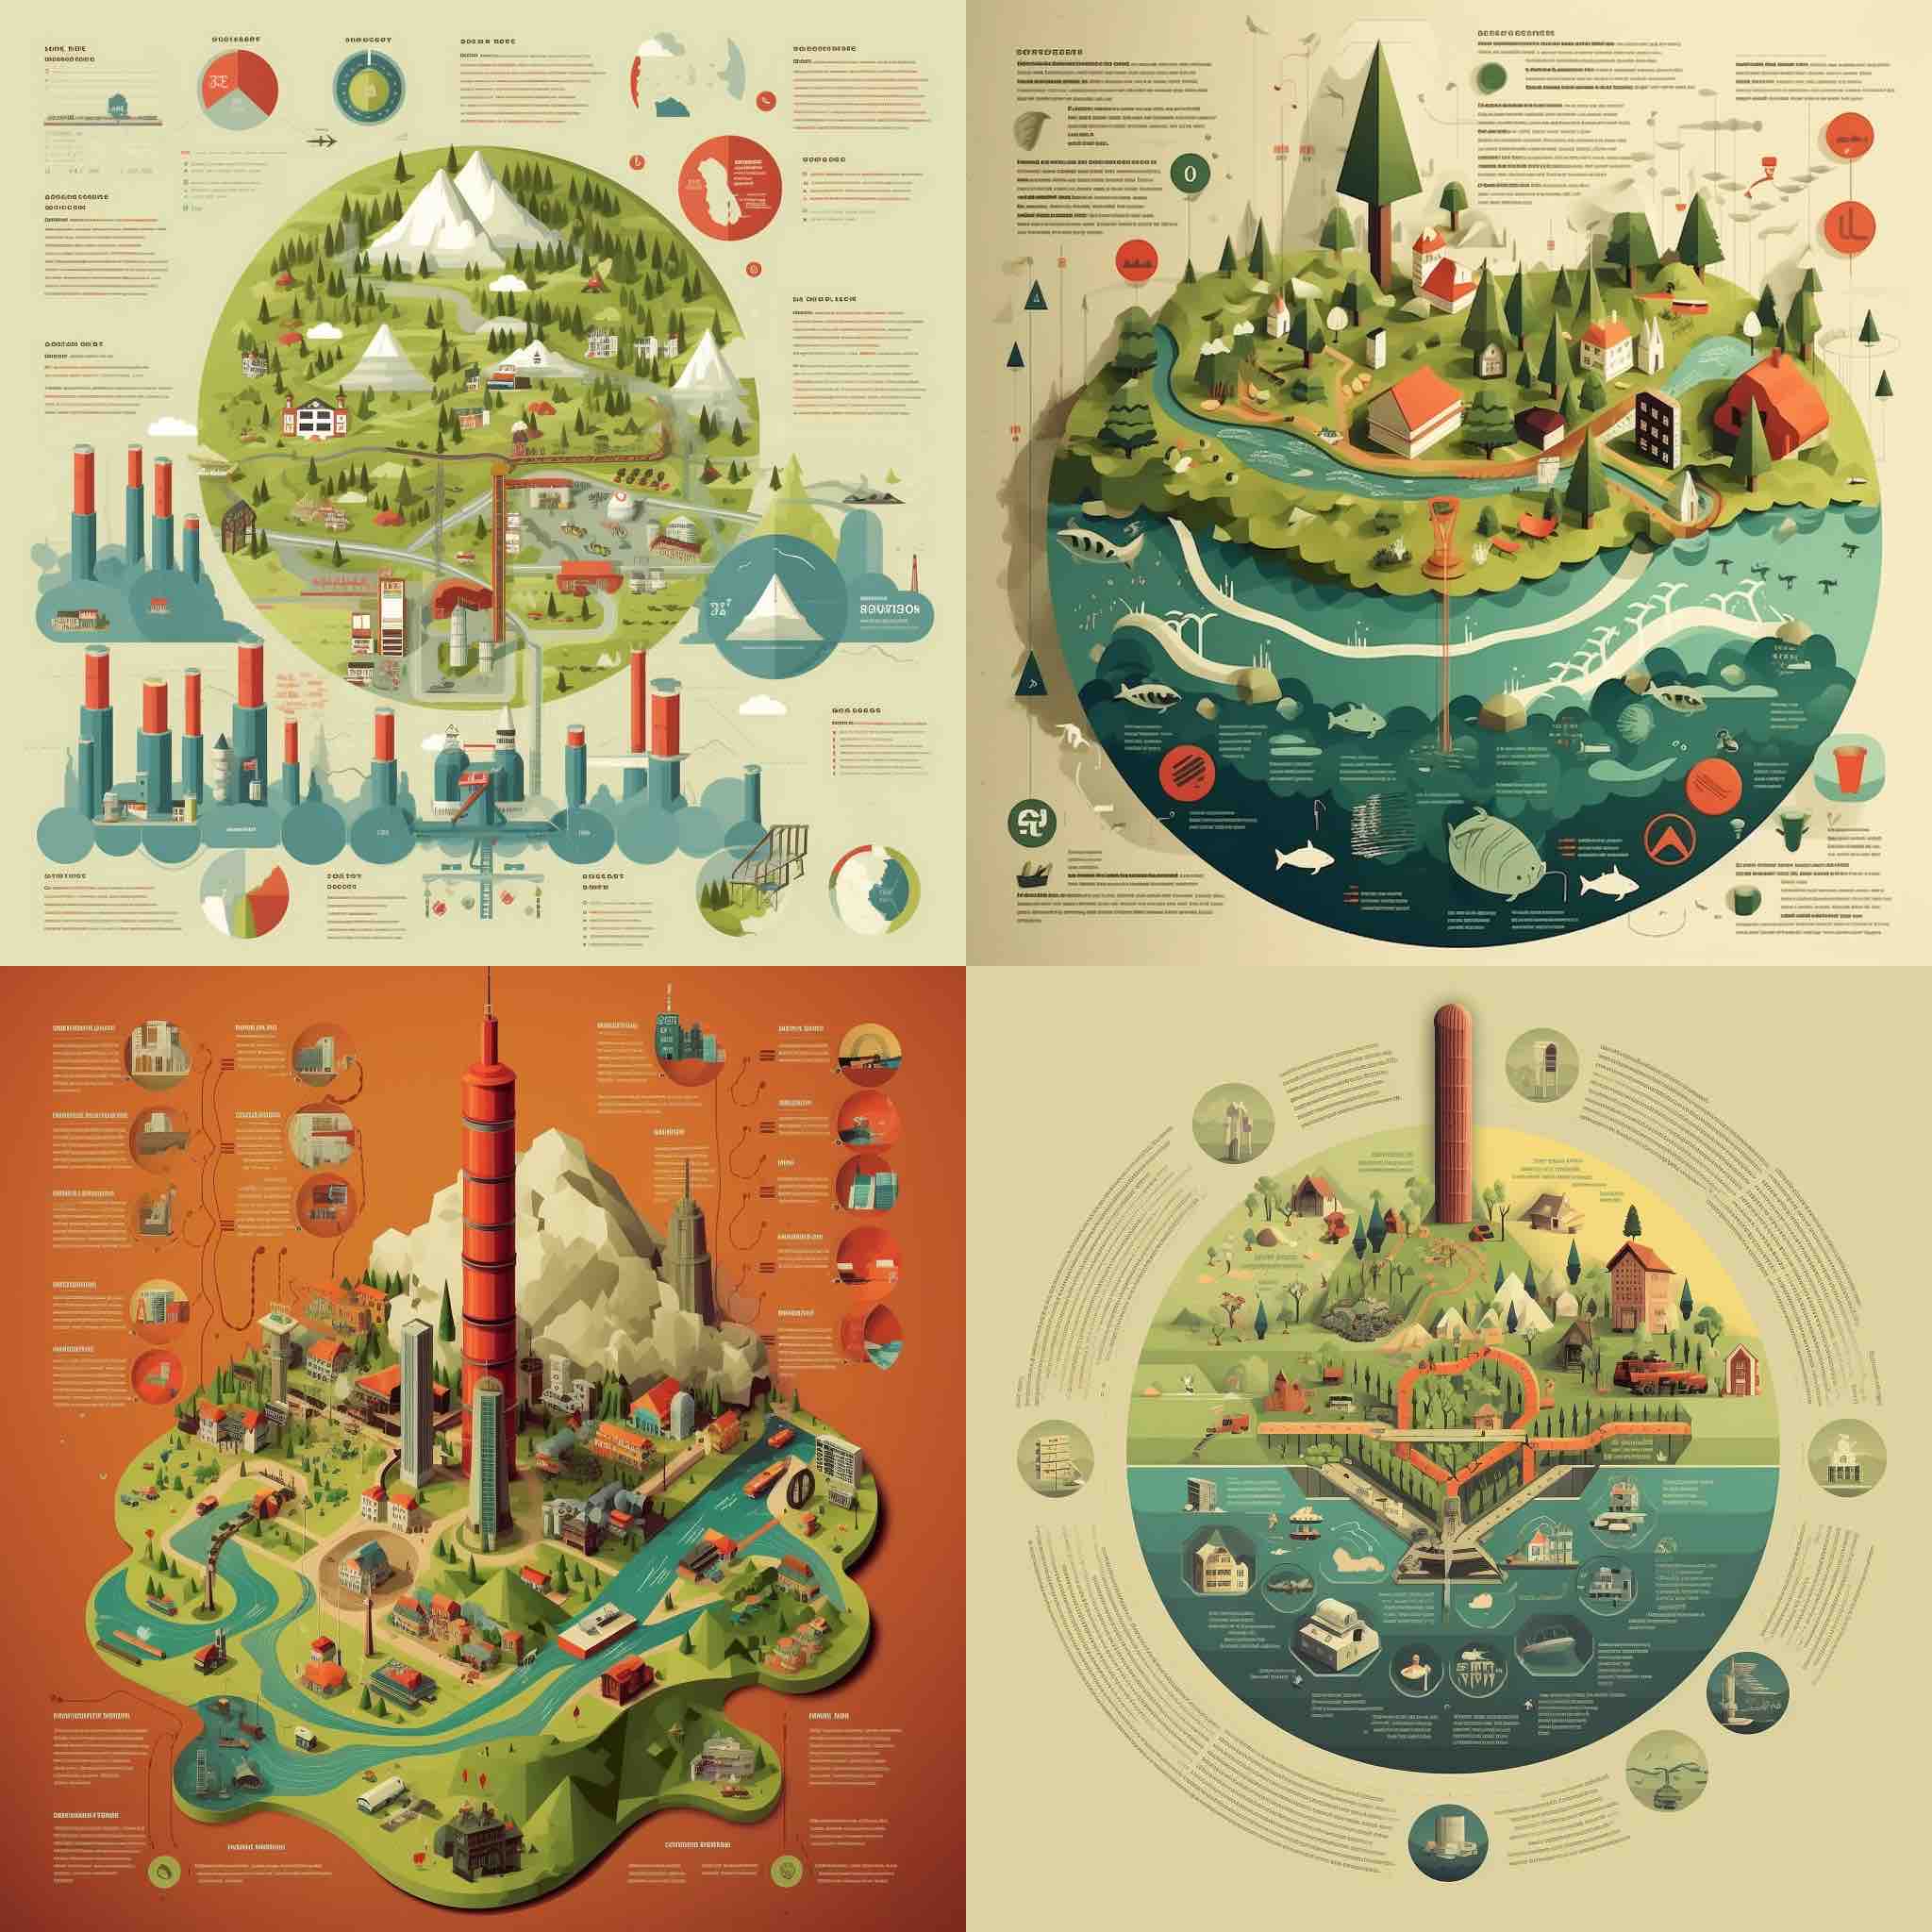
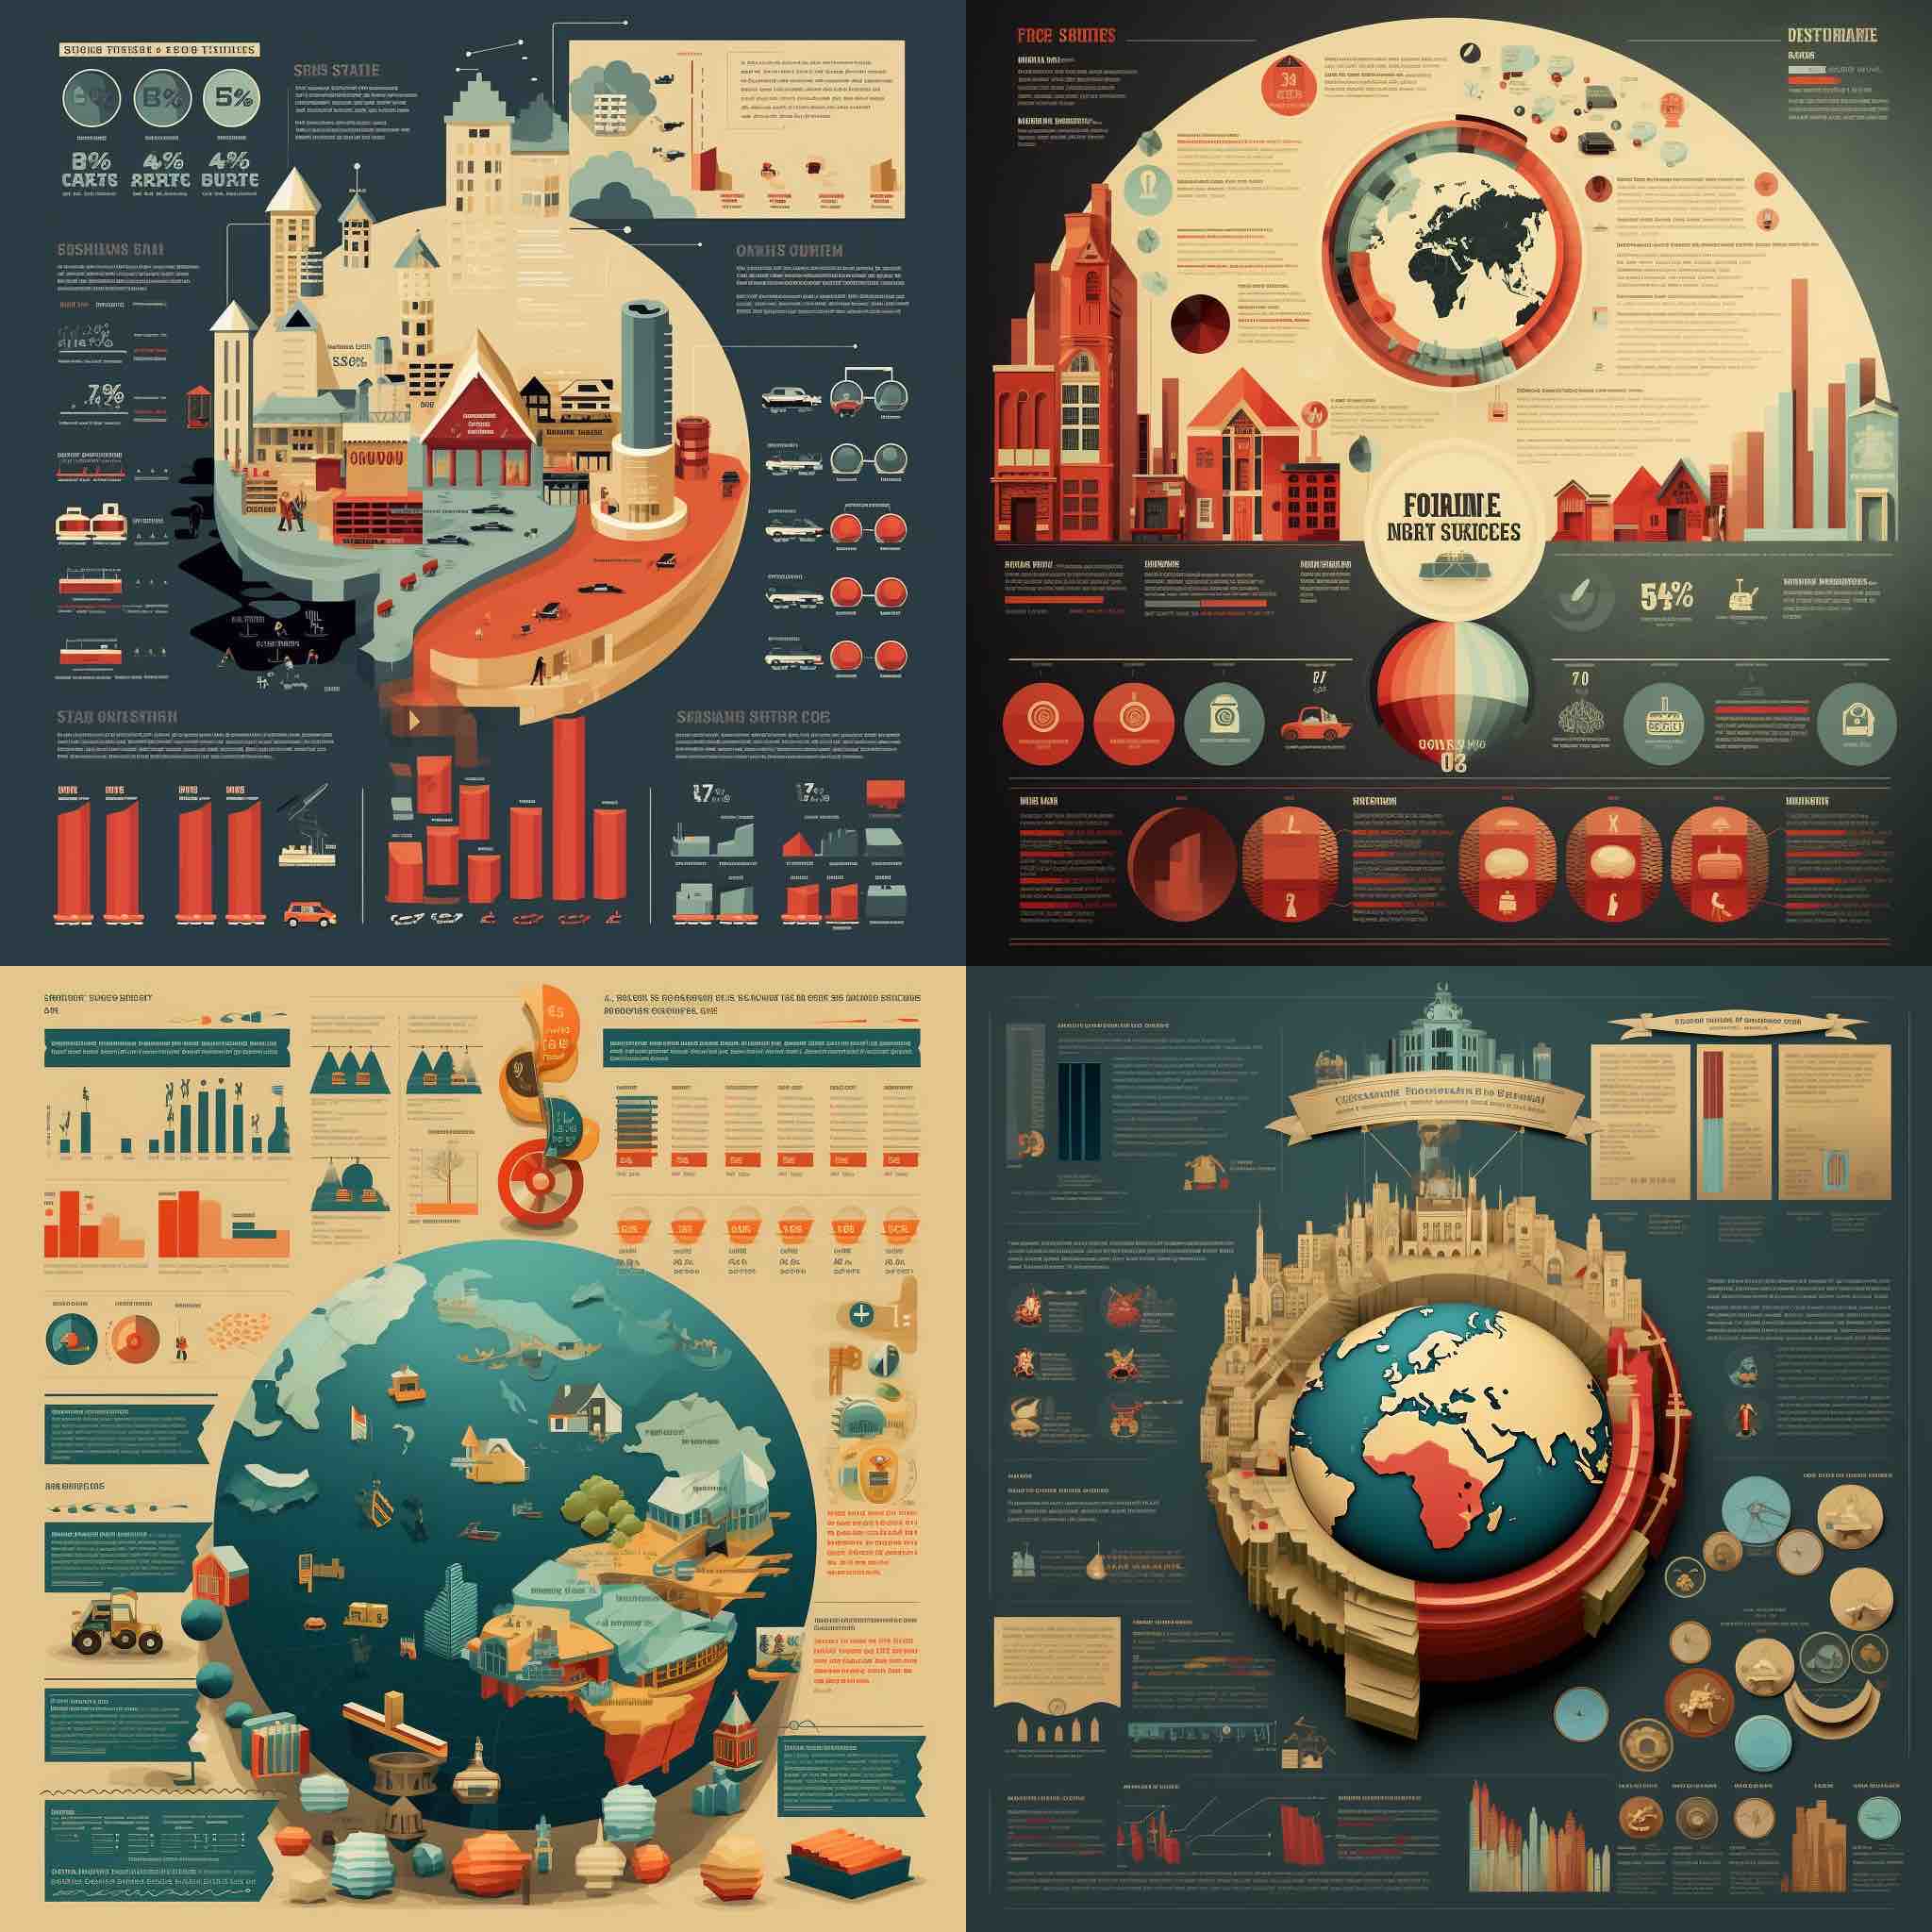
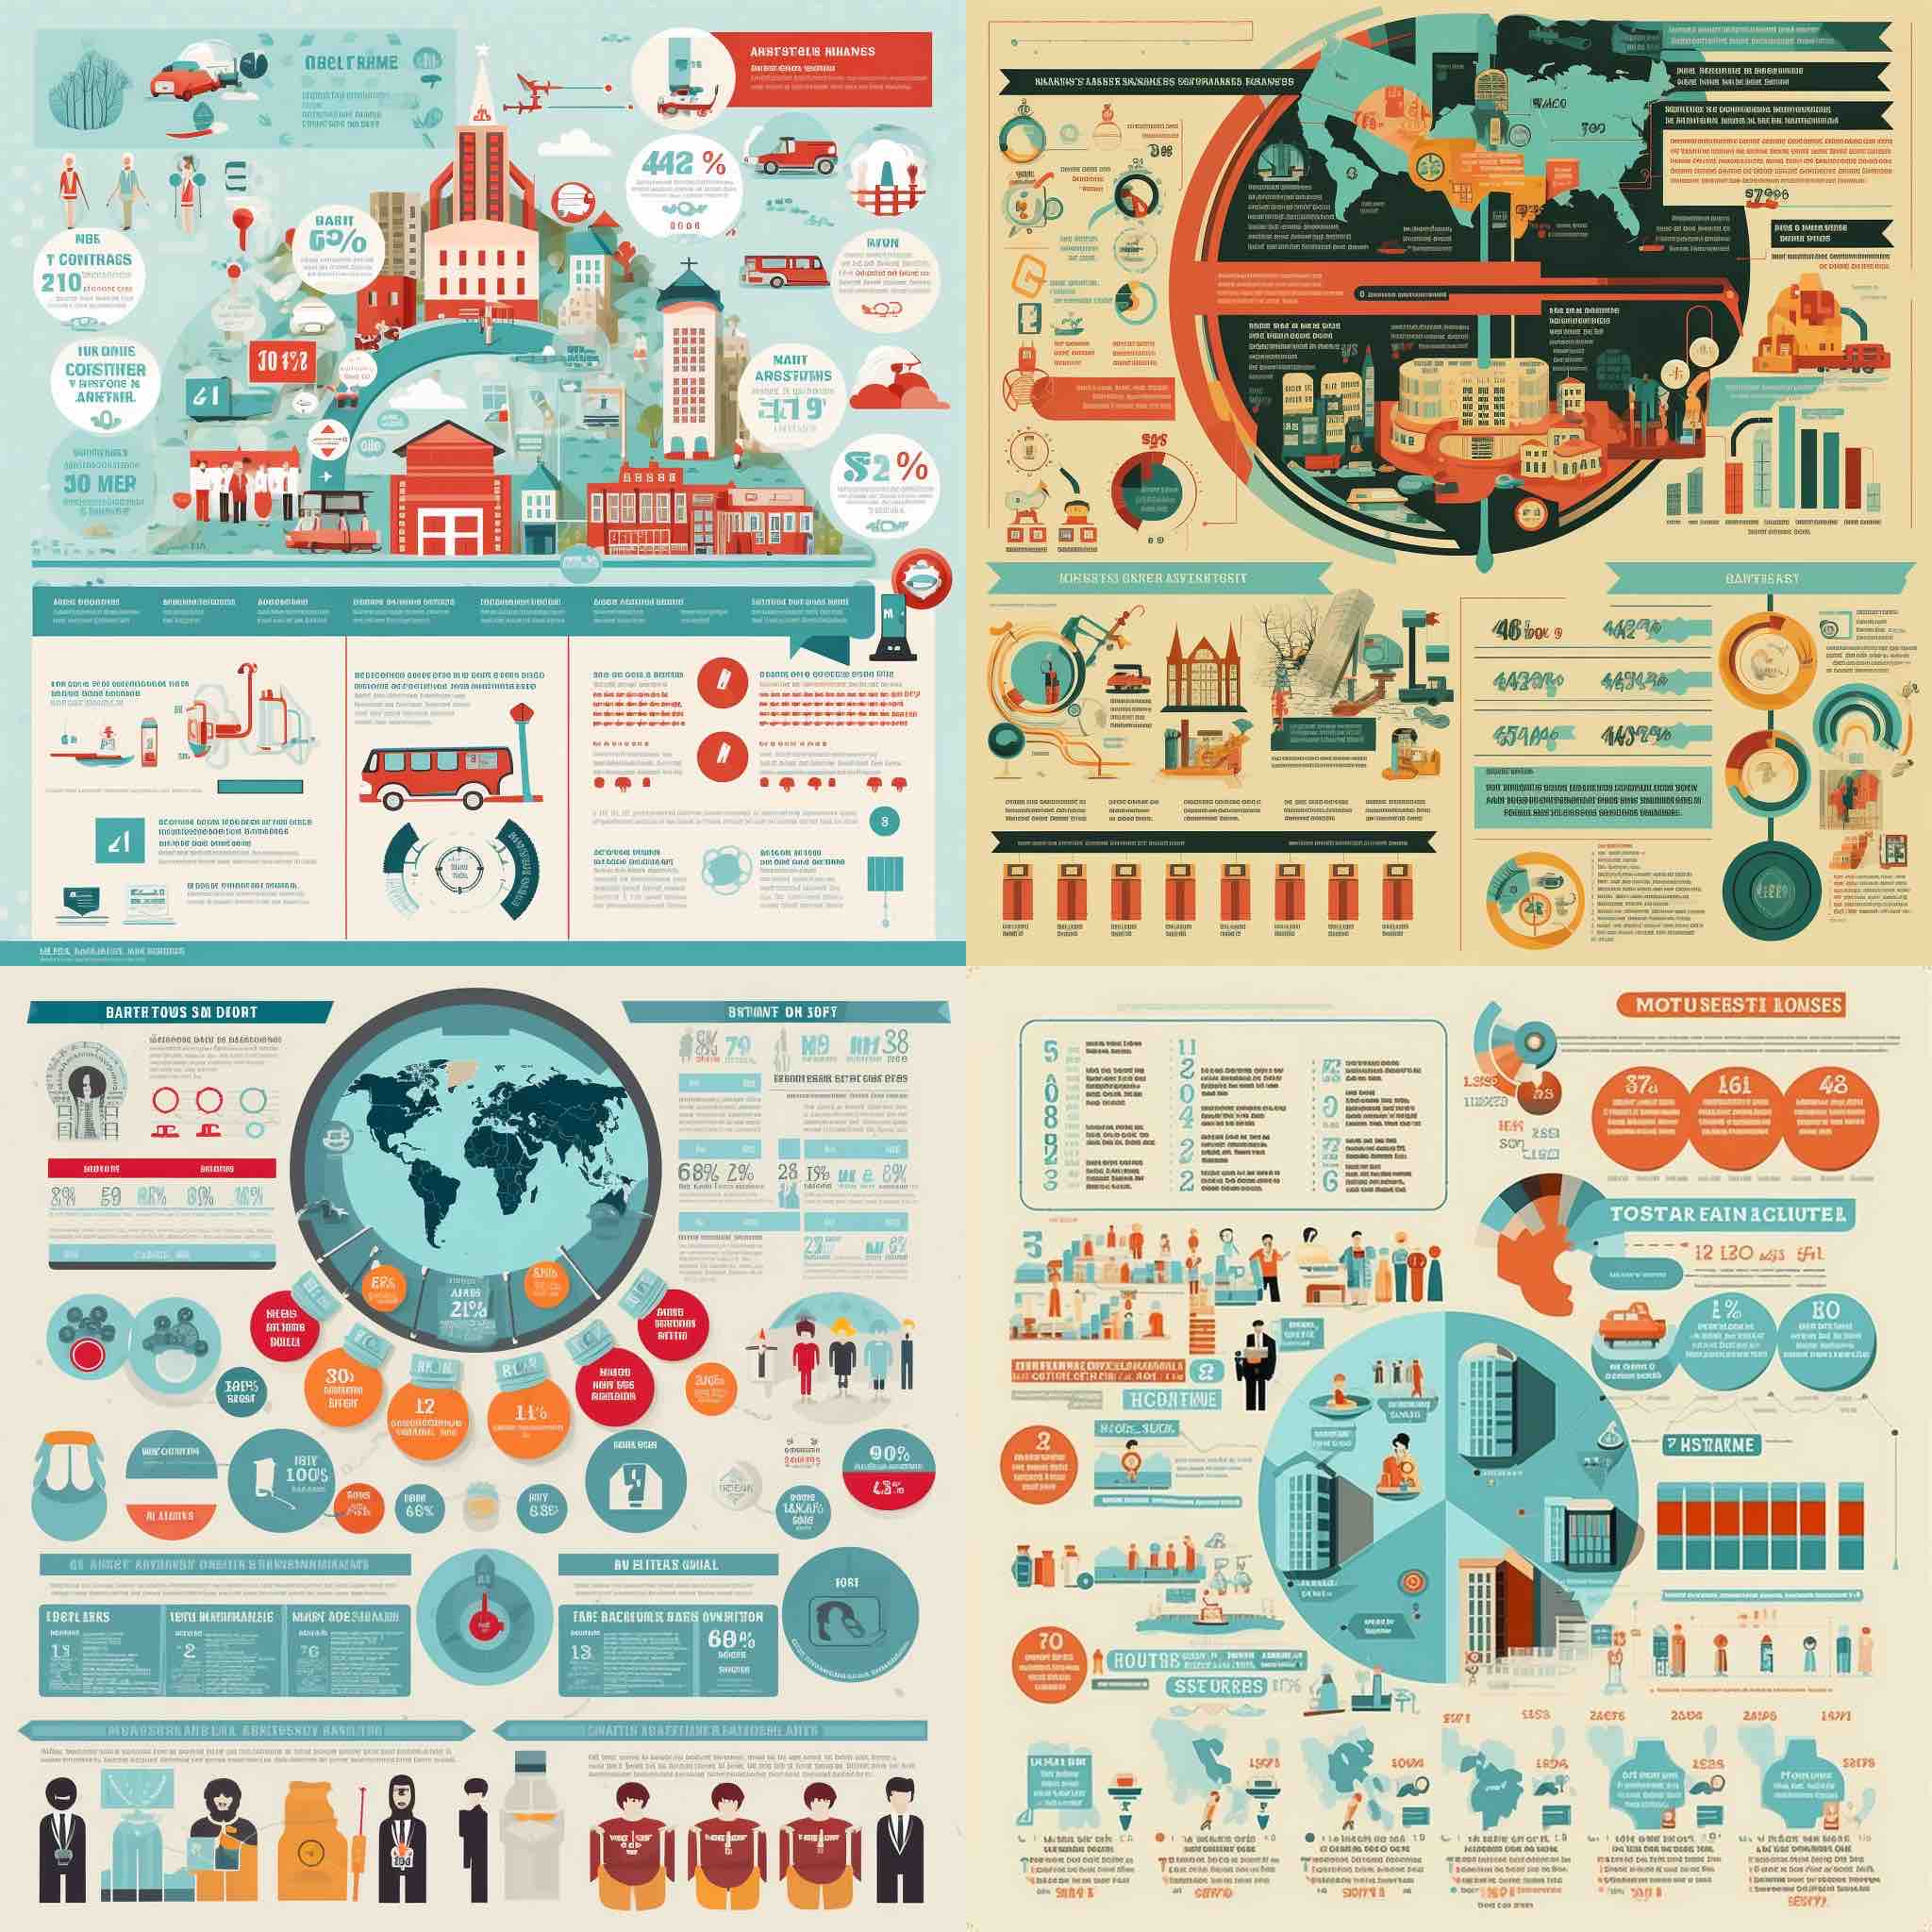
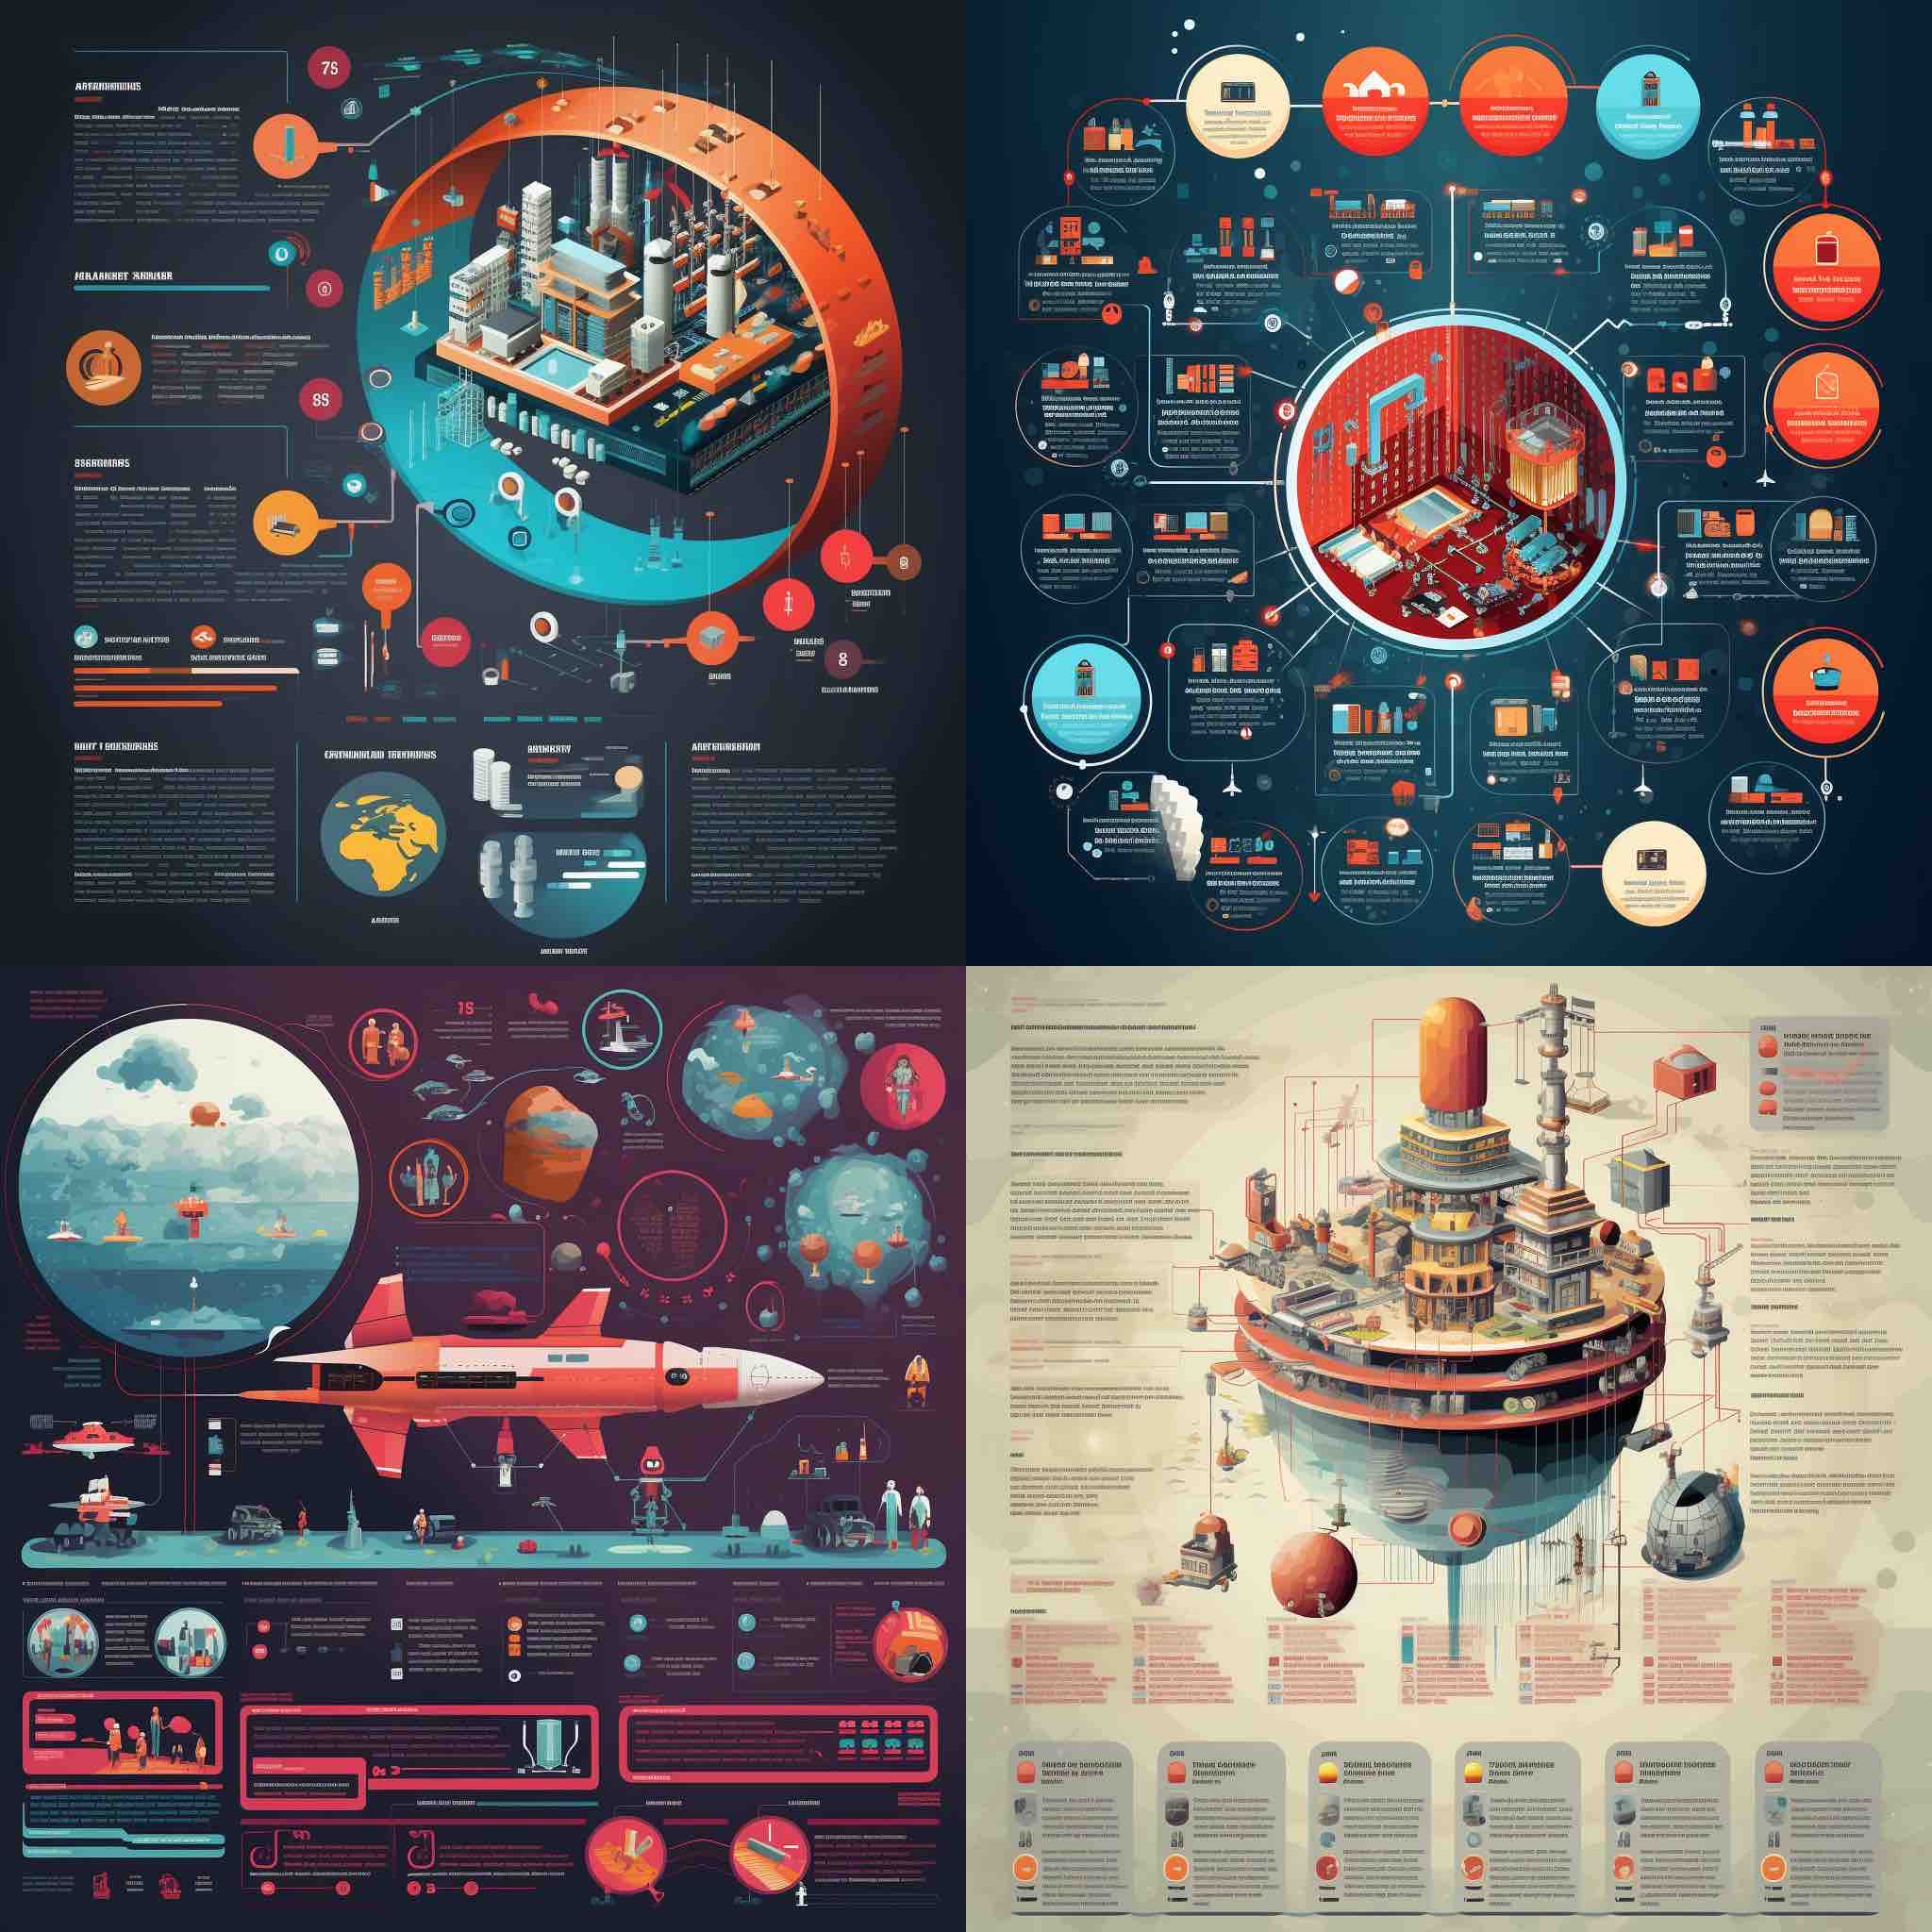
指的是一種特殊的平面設計,通常用於表達大量資訊和數據。資訊圖表的設計旨在以圖像和文字的形式,呈現大量的資訊和數據,以幫助人們理解和分析。資訊圖表的設計包括選擇和使用不同的圖像、符號、顏色和排版等,以表達資訊和數據的特點和風格。資訊圖表常用於新聞報道、商業報告、教育和宣傳等場合。


Example 1
/imagine prompt:healthcare infographic, Infographic, —v 5.1 --q 2Example 2
/imagine prompt:technology infographic, Infographic, —v 5.1 --q 2Example 3
/imagine prompt:environmental infographic, Infographic, —v 5.1 --q 2Example 4
/imagine prompt:financial infographic, Infographic, —v 5.1 --q 2Example 5
/imagine prompt:customizable infographic, Infographic, —v 5.1 --q 2